
The Big Wave Trading Portfolio remains under a SELL signal but there is definitely strength in Big-Caps, especially in the Energy and REIT sectors, and thus the SP-500 and DJ-30 have moved back into a NEUTRAL position on the most short-term time models only. Unfortunately for those that want to be bullish here, the recent price action has not been strong enough to switch the model to NEUTRAL, despite the strength in defensive names and the recent purchases of leading stocks in these defensive industries in our portfolio.
While it was a positive week for stocks and a good week for our recent Energy and REIT stock purchases there was more than enough evidence on my end to suggest that this is nothing more than a dead-cat bounce for now. The oversold nature of the rally on Monday, Tuesday, and Wednesday was clear with many of my top stock/high priced stock scans showing advancers beating decliners by an average of 8.5/9-to-1 ratio. This action is very typical in downtrending markets and is not a sign of a healthy rally. Especially when volume is below average. The one saving grace for the oversold crowd is that the market did experience normal adv/dec action on Friday. Sadly, the close left a lot to the imagination.
While the crowd has become accustomed to the buy-any-dip mantra, it does appear we finally have some real change going on as this bounce is only favoring defensive industries. These industries were already showing strength on a RS basis since the January sell off started and they continue that as we sell off here. If this bounce was healthy, I do believe we would be seeing strength from our previous leading growth stocks. The fact that the remain laggards and are trying to build sloppy consolidation patterns with volume showing much more heavy distribution to accumulation should be a warning sign to traders. If the tape was healthy, these stocks would be leading and we would also be seeing a rotation into new leadership.
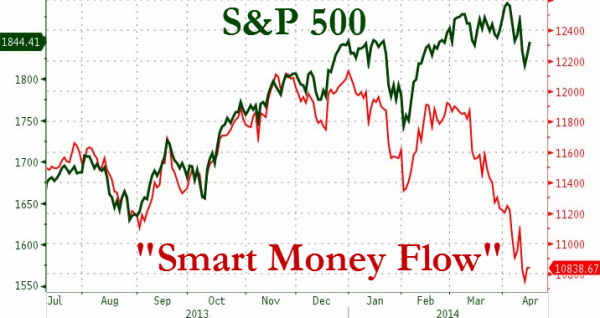
On top of this, there are other market metrics flashing warning signs to go along with everything I have posted in this weekend section the past two weekends. One of the more recent indicators to cross my deck this week was a chart of the ‘money flow index’ from Bloomberg. If you look below you can see there is a huge divergence forming between these two lines. These lines like to meet back up with each other when divergence like this appears. With the state of the tape, the odds are in favor that price will have to come down and match this ‘money flow index’ just like it back in 2007 and in 2000.
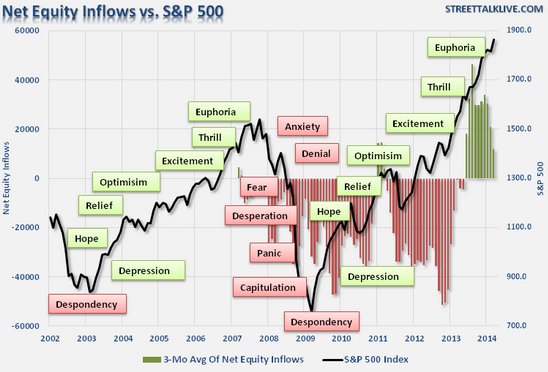
And just who is the smart money selling to? Well one look at the chart below and it becomes clear who has decided to start buying the supply lately.
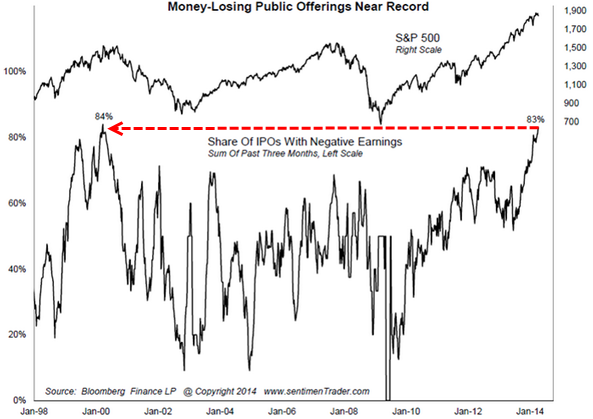
With the retail crowd now decided to buy stocks it appears that it is time for institutional banks to flood our market with that supply in the form of money losing companies. Not since 2000 have we seen so many IPOs come public that lose money. I guess the mantra is get it out and public while there is money to be made before the whole thing collapses.
So when we look at the price action since January alone it becomes clear something is wrong. When we then take the only fact that matters price and overlap it with all the sentiment and other internal market data it does appear that after six-years of QE manipulation this market is running on fumes. Companies have done everything they could to grow their bottom line while the top line remains anemic. Cutting cost, firing workers, low wages, share buybacks, financing at low rates, and anything and everything they could do to make the bottom line look better they did. Now what is left?
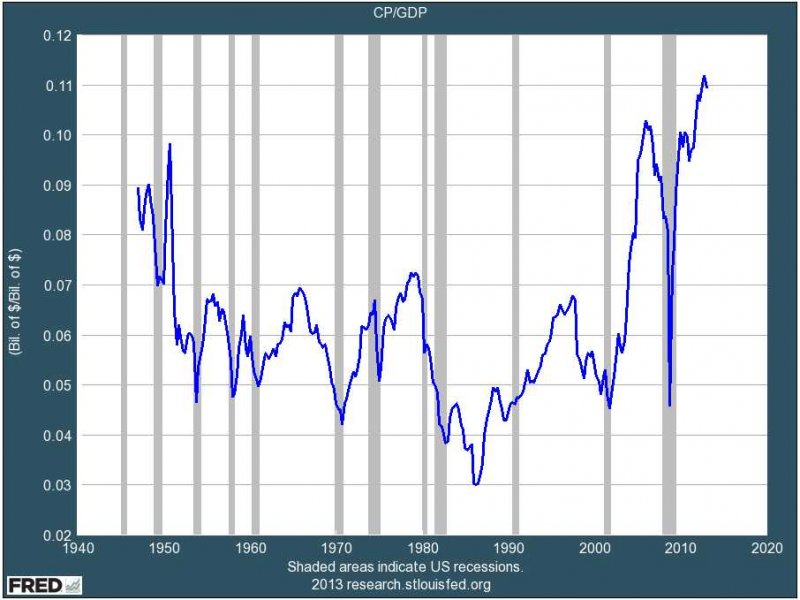
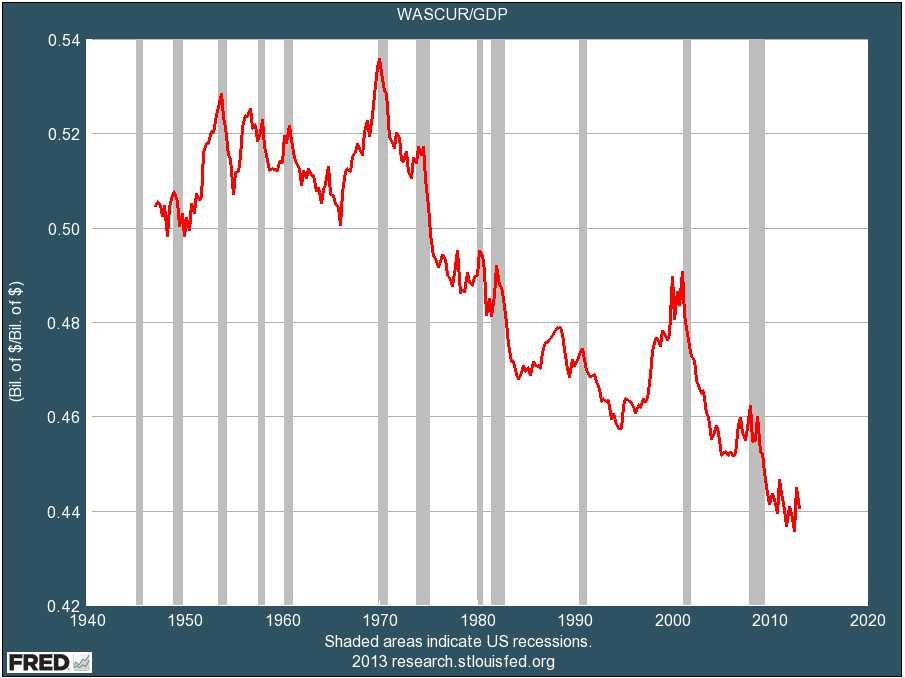
Do you really think the charts below can sustain this market for much longer? The divide between corporate profits and wages continues to grow to comical levels in the United States oligarchy. This is not sustainable and history suggest these data points will at some time need to revert to the mean. That is if you want a real healthy economy. I am not sure the Federal Reserve or the United States corrupt crony-capitalist government really wants that. We’ll see. It should be an exciting 2014.
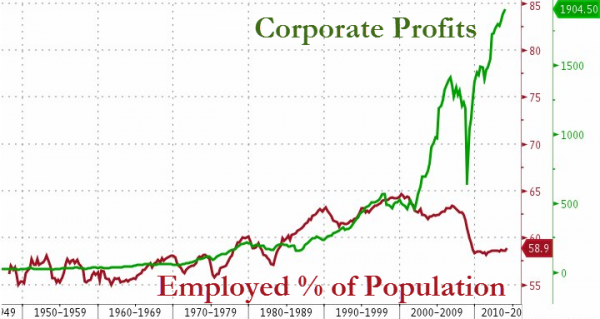
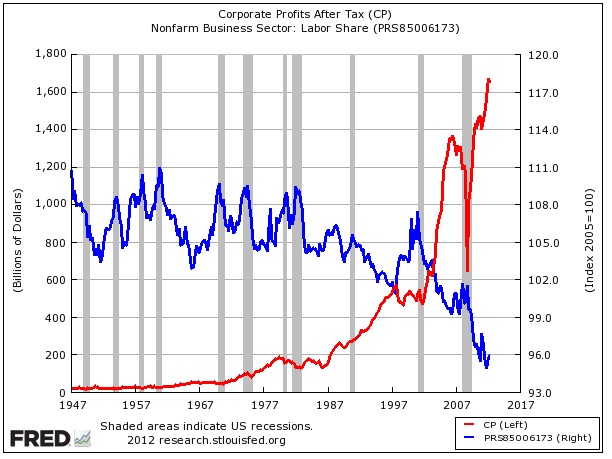
CORPORATE PROFITS:
WAGES:
So on that lovely note I wish you all a great rest of your long Easter weekend from the beautiful island of Maui where everyday is Easter. That is if you like perfect weather 365/24/7. Aloha.
TOP CURRENT HOLDINGS – PERCENT GAIN SINCE SIGNAL DATE – SIGNAL DATE
VIPS long – 315% – 7/17/13
HEES long – 216% – 9/4/12
AER long – 128% – 6/27/13
WDC long – 107% – 1/9/13
USCR long – 74% – 4/12/13
TPL long – 54% – 10/22/13
JBT long – 28% – 9/11/13