
The stock market put in an impressive day as volume expanded across the board. The NASDAQ and Russell 2000 led the market higher as risk is back on. Volume expanded across the board day over day in a good sign traders and investors alike were happy to add stocks to their portfolios. While we can gripe about how volume was lower compared to its average volume, but we have seen this situation in the past. More importantly, the Russell 2000 saw its 50 day cross above its 200 day. A solid session all around. Many are searching for the reason as to why this market moved higher. We simply cared that it moved higher and we will react accordingly. Rally appears to be back on and we’ll certainly take full advantage of the situation.
Focusing in on IWM we see decent consolidation since the middle of April. Volume was excellent today as the ETF climbed back towards its May high. It was nice to see risk assets jump and lead this market higher. We certainly have the recipe for a decent rally. We continue to see a lack of bulls and general interest in this market. Market pundits continue to downplay this market and we are headed for an imminent collapse. Given the price action of the market it is very unlikely we’ll see this market collapse soon. For now, we can only trade on what we know and what we know is we have an uptrend in place. Keep it simple.
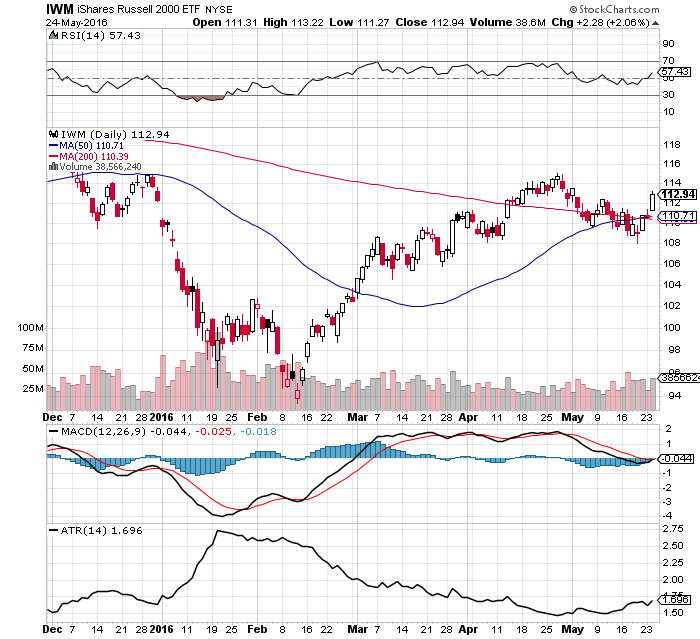
One thing to note on this chart is how IWM’s average true range remained low during its recent consolidation. The low average true range extends to the QQQs as well:
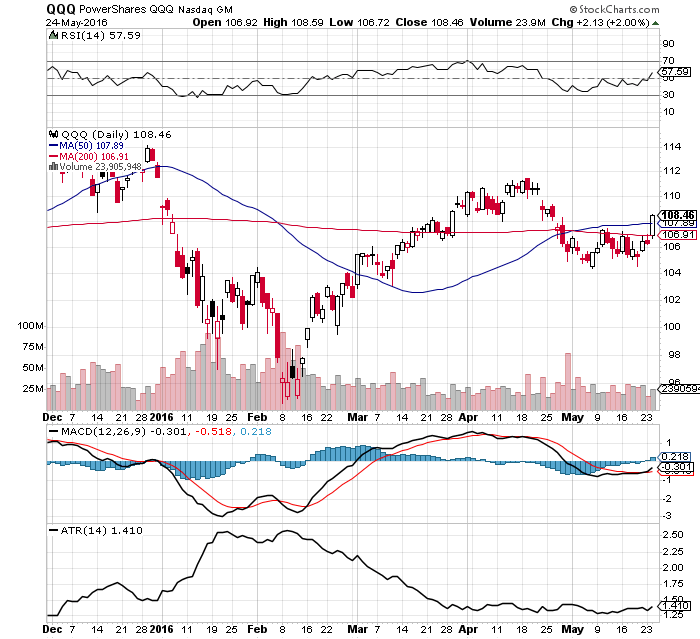
Even SPY sports a low average true range and more importantly is back above the 50 day moving average:
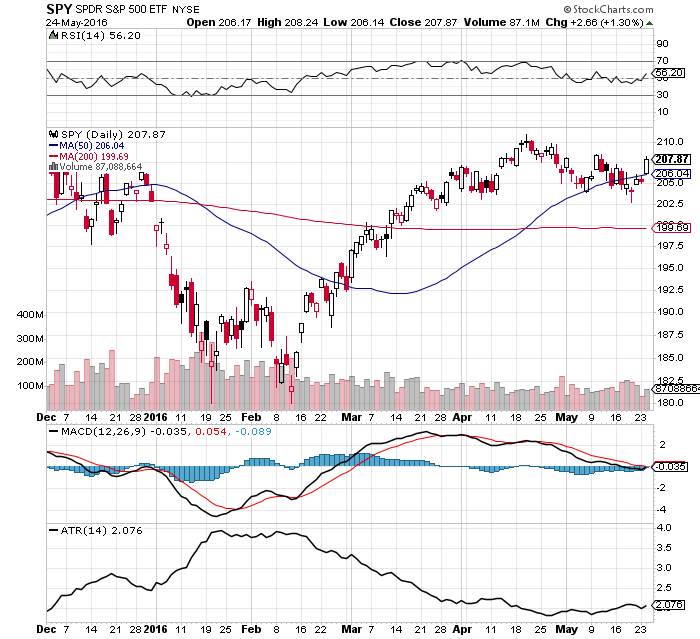
The recent consolidation across IWM, QQQ, and SPY is certainly long enough and within a tight range to launch a solid rally. Seasonality does come into play and may limit the upside we have. We wouldn’t want you to miss out on gains. Therefore, we are bringing back the SELLINMAY coupon. Get 30% off across all our subscriptions. The deal will last through the end of May. Do not delay as you could miss out on the next big winner!
A solid session indeed. We will operate as such and extract as many gains as we can from this market. Come along and join us!


I would love to sign up but I am still waiting to see your performance numbers. I have sent comments here and through email asking for this. Is it not fair to ask for these before signing up? I would like to see your performance by trade for 2015 and 2016 and/or your performance by your recommended portfolio for 2015 and 2016. Thanks.
A. Stott
I will respond to all comments tonight. I just returned from the mainland after being away for 2 weeks and I am in the process of moving to a larger condo suite in my building. My sincerest apologies.
A quick note: 2015 I was up 2%. So far in 2016 I have a 10% gain. I am not a daytrader and EOD trend following does not return the same returns that it used to. I plan on going back to fulltime daytrading as well as using my EOD trend following methodology in the next few years. Right now, it is not possible with my current lifestyle on Maui due to time zone issues. My average 35% gains from 1996-2008 have been replaced by an average 2% gains from 2008-2016 due to a -10% return in 2011 and a -20% return in 2012. I have adapted to the current market since but the returns are still low overall due to the constant wild volatility in the major averages. It is what it is. I post all of my buy, short, sell and covers in the evening (Maui time) before I enter the orders on my end. I post the percentage of my account capital I place in each position. Aloha A. Scott. We offer a free week trial, if you were not aware.
I’d also like to see your trading summary for the past few years, if you would be so kind as to send me a copy as well.